BLT 둘러보기
BLT에는 매우 많은 기능을 지원하고 있어 모두 소개할 수는 없지만, 간단하게 그래프 기능만 보도록 하겠습니다.
먼저 그래프를 그리기 위해 벡터(vector)의 개념을 이해해 볼 필요가 있습니다.
벡터 (vector)
벡터는 Tcl의 배열과 비슷하지만, Tcl의 배열에는 없는 특징이 있습니다.
- 배열의 인덱스는 0부터 n까지의 숫자이다.
- 모든 요소는 부동소수점수(float)이다.
- 벡터를 명령어처럼 사용할 수 있다.
벡터를 생성할 때는 vector create를 사용합니다. 생성된 벡터의 각 요소의 초기값은 0(0.0)이 됩니다.
package require BLT
namespace import blt::*

# 벡터 x 생성 (0~9)
vector create x(10)
=> ::x
# 벡터 y 생성 (0~9)
vector create y(10)
=> ::y
# 벡터 z 생성 (1~10)
vector create y(1:10)
=> ::z
벡터를 삭제할 때는 vector destroy를 사용합니다.
# 벡터 x y z 삭제
vector destroy x y z
벡터의 각 요소는 인덱스(0~n)를 사용하여 배열처럼 접근할 수 있습니다. 인덱스에 end를 사용하면 마지막 요소를 지정할 수 있습니다. 또한, 콜론(:)을 사용하면 요소의 범위를 지정할 수 있습니다.
# 벡터의 초기화
foreach i {0 1 2 3 4 5 6 7 8 9} {
   set x($i) $i
}
# 첫 번째 요소
puts $x(0)
=> 0.0
# 마지막 요소
puts $x(end)
=> 0.9
# 0~3 범위의 요소
puts $x(0:3)
=> 0.0 0.1 0.2 0.3
# 모든 요소
puts $x(:)
=> 0.0 1.0 2.0 3.0 4.0 5.0 6.0 7.0 8.0 9.0
# 1+2번째 요소
puts $x(1+2)
=> 3.0
인덱스에 min, max, mean을 사용하면 최소값, 최대값, 평균값을 구할 수 있습니다.
# 벡터의 초기화
foreach i {0 1 2 3 4 5 6 7 8 9} {
   set x($i) $i
}
# 최소값
puts $x(min)
=> 0.0
# 최대값
puts $x(max)
=> 9.0
# 평균값
puts $x(mean)
=> 4.5
동적으로 벡터를 생성할 수도 있습니다. 벡터 생성 시 요소의 개수를 지정하지 않은 대신 "++end"를 사용해서 동적으로 요소를 할당합니다.
# 동적 벡터 d 생성
vector create d
# 벡터 초기화
foreach i {0 1 2 3 4 5 6 7 8 9} {
    set d(++end) $i
}
# 모든 요소 출력
puts $d(:)
=> 0.0 1.0 2.0 3.0 4.0 5.0 6.0 7.0 8.0 9.0
벡터를 생성하면 커맨드로도 사용할 수 있습니다.
# 벡터 z를 생성
vector create z
# 요소 초기화
z set {9 8 7 6 5 4 3 2 1 0}
# 요소 개수 확인
z length
=> 10
# 요소를 오름차순 또는 내림차순 정렬
z sort
z sort -reverse
# 범위의 요소 반환
z range 0 end
=> 0.0 1.0 2.0 3.0 4.0 5.0 6.0 7.0 8.0 9.0
# 검색한 요소의 인덱스 반환
z search 5.0
=> 5
# 요소 추가
z append {10.0 11.0}
# 모든 요소에 1.0을 더하기
z expr { z + 1 }
# -5에서 5까지 1씩 증가시켜 요소 설정
z seq -5 5 1
# 정규화
z normalize
# 데이터를 보간(보충)
z populate z2 10
# 복제
z dup zz
# 요소 삭제
z delete 1 2
# 요소 병합
z merge v1 v2
# 난수 설정
z random
# 요소를 시프트
z offset -1
# 벡터를 Tcl 배열에 매핑
z variable ary
그래프 (graph)
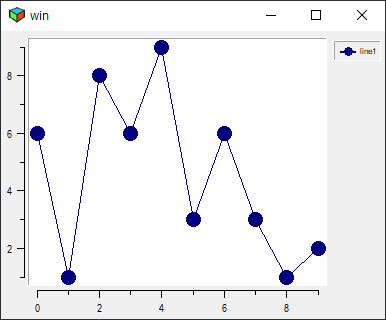
벡터를 사용하면 몇줄의 코드만으로 그래프를 그릴 수 있습니다.
package require BLT
namespace import blt::*

vector create x y
x set {0 1 2 3 4 5 6 7 8 9}
y set {6 1 8 6 9 3 6 3 1 2}

pack [graph .graph -width 4i -height 3i] -fill both -expand 1

.graph element create line1 -xdata x -ydata y
벡터를 사용하지 않는 방법도 있습니다. 벡터 대신 리스트를 사용할 수 있습니다.
package require BLT
namespace import blt::*

set x {0 1 2 3 4 5 6 7 8 9}
set y {6 1 8 6 9 3 6 3 1 2}

pack [graph .graph -width 4i -height 2i] -fill both -expand 1

.graph element create line1 -xdata $x -ydata $y
벡터를 사용하지 않는 또 다른 방법입니다. x축과 y축 데이터를 함께 지정합니다.
package require BLT
namespace import blt::*

set xy {0 6 1 1 2 8 3 6 4 9 5 3 6 6 7 3 8 1 9 2}

pack [graph .graph -width 4i -height 2i] -fill both -expand 1

.graph element create line1 -data $xy
다음 샘플은 리소스를 사용해 그래프를 꾸민 예시입니다. 그래프의 확대/축소도 지원됩니다.

package require BLT
namespace import blt::*

option add *graph.line1.Color blue
option add *graph.line2.Color red
option add *graph.line3.Color green
option add *graph.line1.Symbol diamond
option add *graph.line2.Symbol arrow
option add *graph.line3.Symbol triangle
option add *graph.activeLine.Color yellow
option add *graph.activeLine.Symbol circle
option add *graph.Legend.ActiveBackground yellow
option add *graph.Title 그래프
option add *graph.x.Title 월
option add *graph.y.Title 금액
option add *graph.Axis.TitleFont {{MS ゴシック} 10}

pack [graph .graph -width 4i -height 2i] -fill both -expand 1
.graph element create line1 -data { 1 2 2 4 3 6 4 7}
.graph element create line2 -data { 1 2 2 5 3 7 4 8}
.graph element create line3 -data { 1 2 2 6 3 8 4 9}

Blt_ZoomStack .graph
#Blt_Crosshairs .graph
Blt_ActiveLegend .graph
Blt_ClosestPoint .graph

.graph element bind all <Enter> {
    %W legend activate [%W element get current]
}

.graph element bind all <Leave> {
    %W legend deactivate [%W element get current]
}
아래는 데이터를 동적으로 추가하여 그래프를 갱신하는 샘플입니다. 마지막에는 스플라인 곡선으로 변환합니다.
package require BLT
namespace import blt::*

option add *graph.normal.Color blue
#option add *graph.normal.Symbol cross
option add *graph.normal.Symbol ""
option add *graph.spline.Color red
#option add *graph.spline.Symbol cross
option add *graph.spline.Symbol ""
option add *graph.activeLine.Color yellow
option add *graph.activeLine.Symbol circle
option add *graph.Legend.ActiveBackground yellow
option add *graph.Title 그래프
option add *graph.x.Title 시간
option add *graph.y.Title 값
option add *graph.Axis.TitleFont {{Gulim} 10}

vector create x y x2 y2

pack [graph .graph -width 4i -height 2i] -fill both -expand 1

.graph element create normal -xdata x -ydata y

Blt_Crosshairs .graph
Blt_ZoomStack .graph
Blt_ActiveLegend .graph
Blt_ClosestPoint .graph

.graph element bind all <Enter> {
    %W legend activate [%W element get current]
}

.graph element bind all <Leave> {
    %W legend deactivate [%W element get current]
}

for {set i 0} {$i < 10} {incr i} {
    set ::x(++end) $i
    set ::y(++end) [expr rand()*10.0]
}

# 스플라인 곡선 변환
x populate x2 10
spline quadratic x y x2 y2
.graph element create spline -xdata x2 -ydata y2
막대그래프 (barchart)
마지막으로 막대그래프의 샘플입니다.

package require BLT
namespace import blt::*

option add *bc.bar1.Foreground blue
option add *bc.bar2.Foreground red
option add *bc.bar3.Foreground green
option add *bc.activeBar.Foreground yellow
#option add *bc.activeBar.Stipple pattern1
option add *bc.Legend.ActiveBackground yellow
option add *bc.Title 막대그래프
option add *bc.x.Title 2002년
option add *bc.y.Title 금액
option add *bc.Axis.TitleFont {{Gulim} 10}
option add *bc.BarMode stacked
option add *bc.x.Command FormatLabel
#option add *bc.x.Rotate 90

proc FormatLabel { w value } {
    # value에서 요소 이름을 결정

    set index [expr round($value)]
    if { $index != $value } {
        return $value
    }
    incr index -1

    set name [lindex { 1\n월 2\n월 3\n월 4\n월 5\n월 } $index]
    return $name
}

pack [barchart .bc -width 4i -height 2i] -fill both -expand 1
.bc element create bar1 -data { 1 4 2 4 3 6 4 8 5 7}
.bc element create bar2 -data { 1 1 2 1 3 1 4 2 5 1}
.bc element create bar3 -data { 1 1 2 1 3 1 4 2 5 1}

Blt_ZoomStack .bc
#Blt_Crosshairs .bc
Blt_ActiveLegend .bc
Blt_ClosestPoint .bc

.bc element bind all <Enter> {
    %W legend activate [%W element get current]
}

.bc element bind all <Leave> {
    %W legend deactivate [%W element get current]
}
원형그래프 (piechart)
아쉽게도 BLT에는 원형그래프를 제공하지 않습니다. 대신 tkpiechart를 사용하세요.